Physician performance
Provider identities, encounter history, work RVUs, and specialty groupings.
Do the reports use the same provider and period?

Prepare the data, make the results useful, and give your team a way to review the work.
Sources Prepared data Computed results Reporting & review
A possible arrangement for an engagement. Each capability can also support work independently.
Groundwork connects source records to shared entities and defined measures. Assess the existing estate, map the data, and build validation into the transformations.
Explore Groundwork →Insights connects headline measures to definitions, trends, and breakdowns. The same scoped metrics can serve connected AI tools through MCP.
Explore Insights →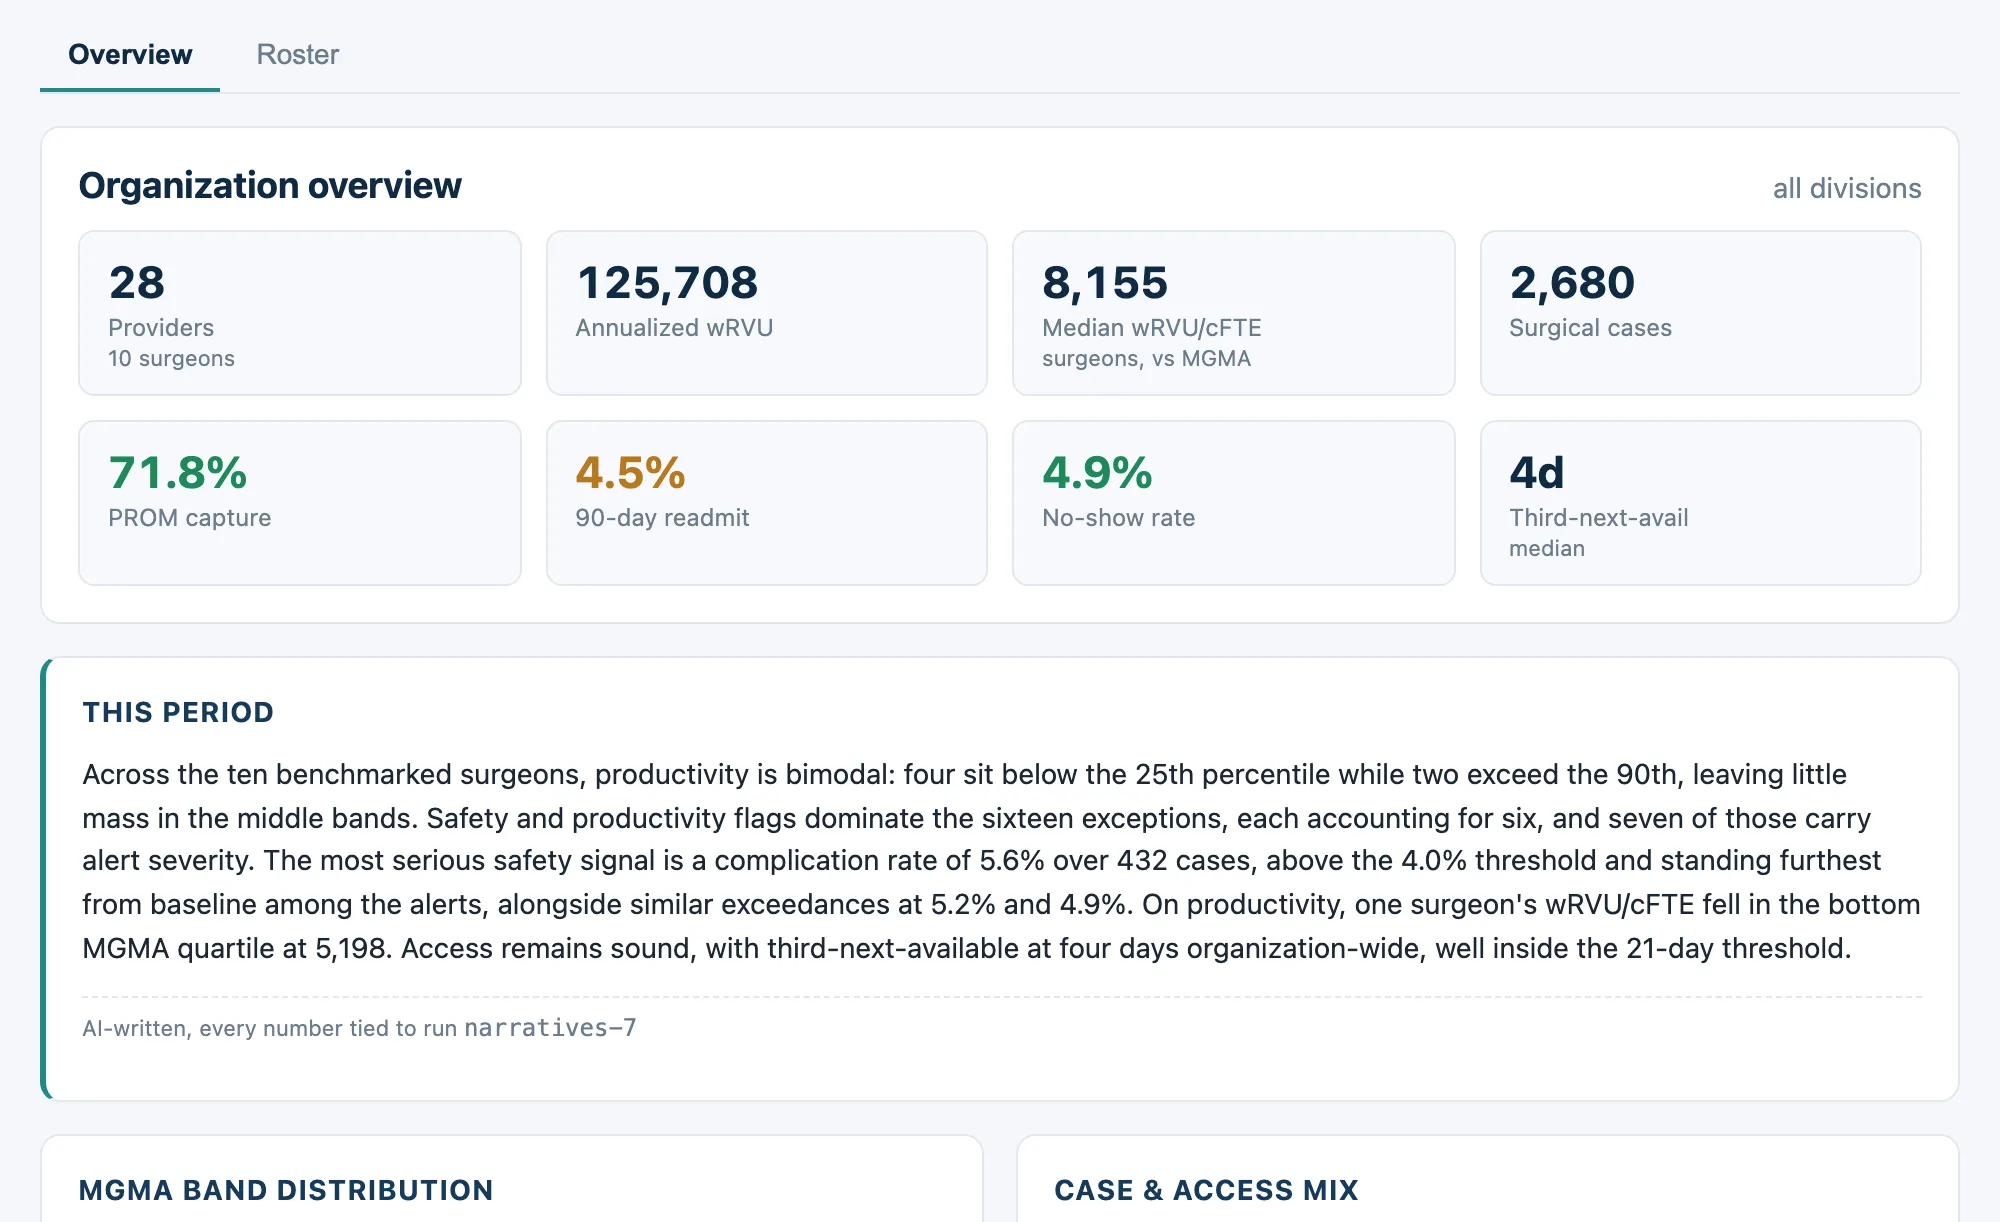 View full-size image (new tab)
 Provenance records instrumented stages, checks, and source evidence. Review the calculation and its inputs alongside the result.
Explore Provenance →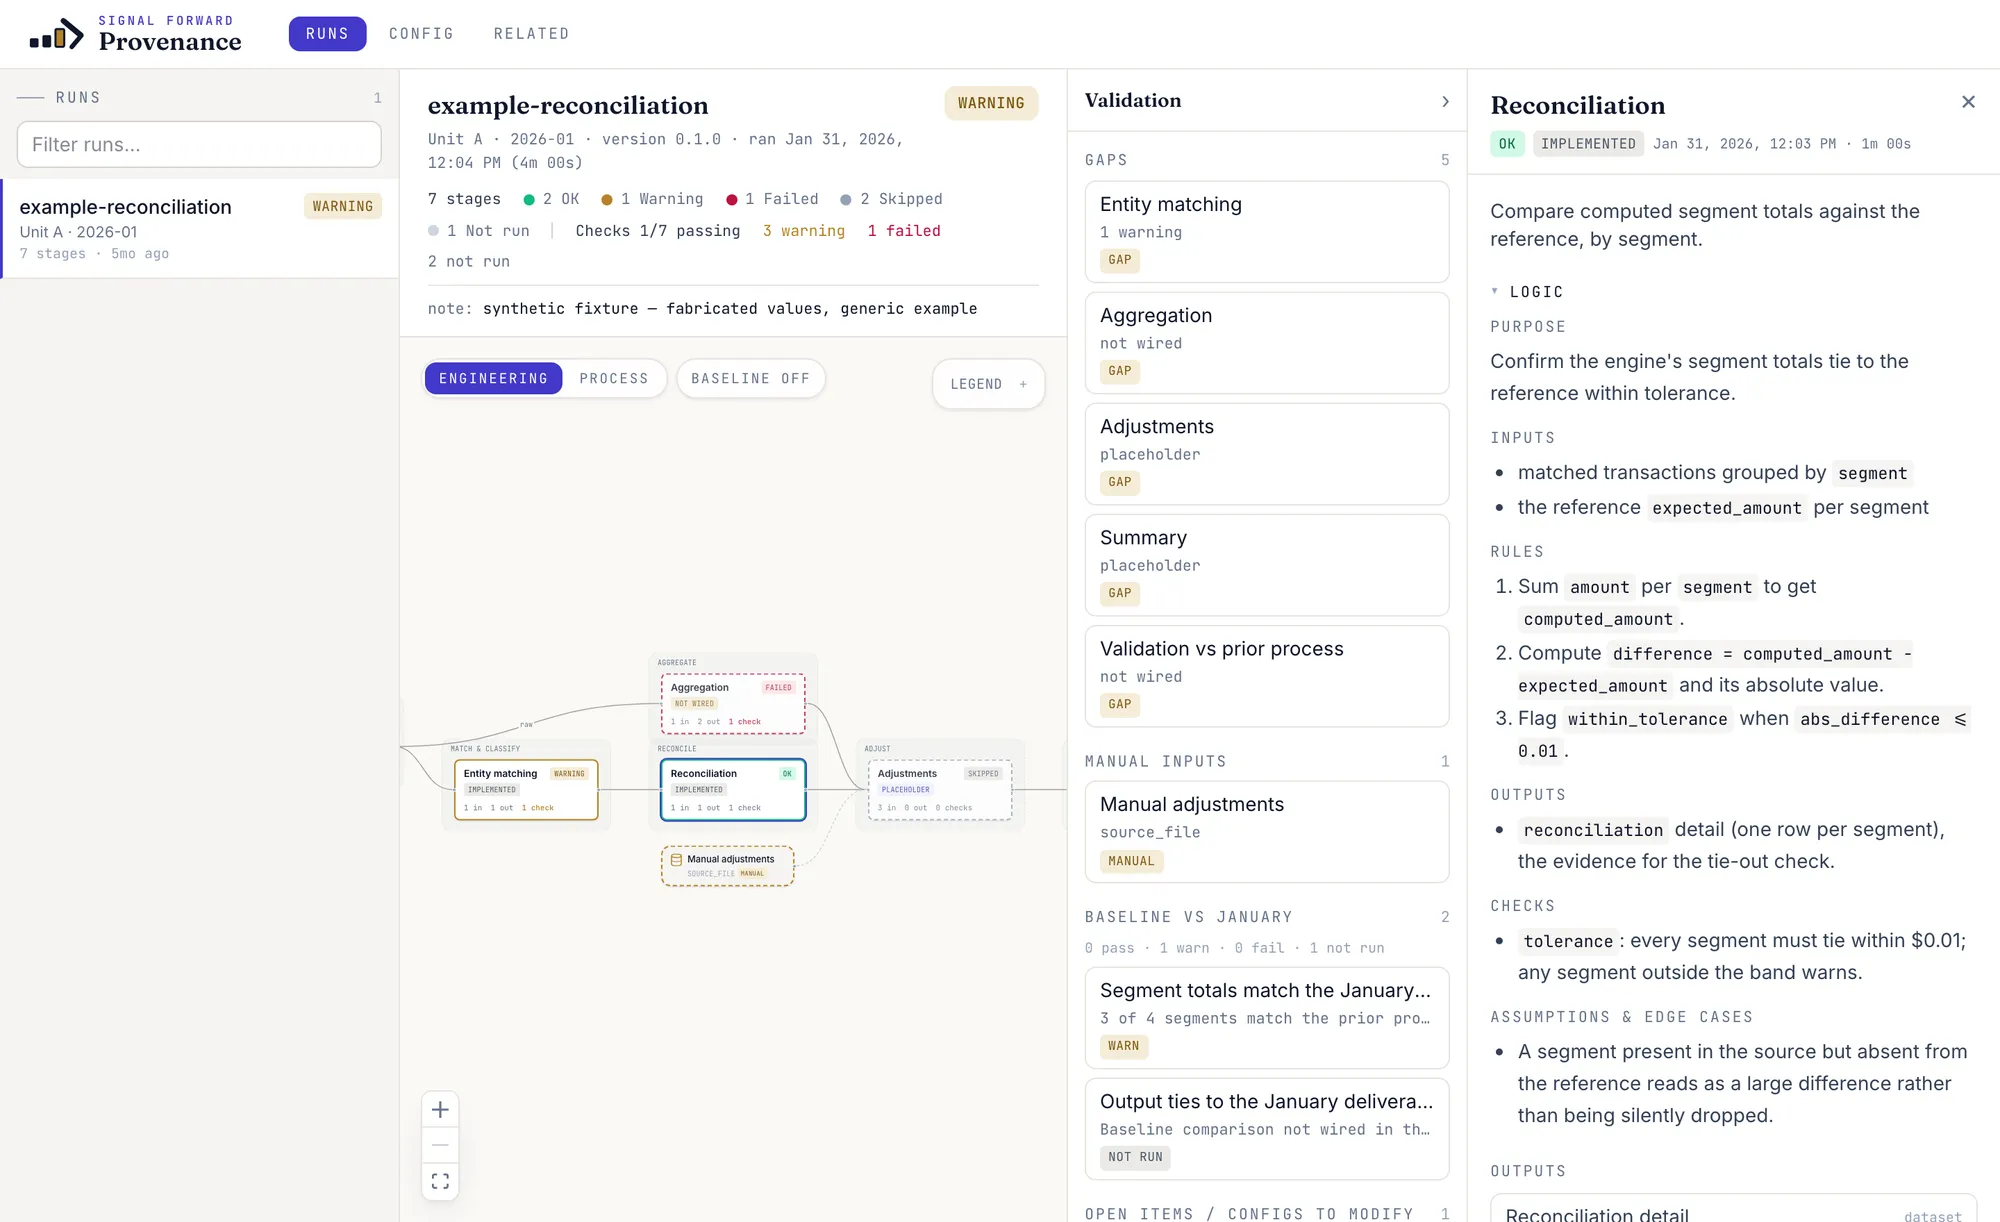 View full-size image (new tab)
 Source mapping, shared definitions, and validation in your cloud. Assess what is ready, resolve the gaps, and build the analytical foundation.
Physician performance, revenue cycle, and operational measures with trends, drill-ins, and governed access for connected AI tools.
A record of instrumented workflow stages, checks, and evidence for review.
Connect the source records, settle the definitions, and make the data ready for the decisions ahead.
We start inside your existing warehouse and reporting estate. Groundwork brings source mapping, data-quality checks, analytical models, and governance into a scoped delivery plan in your cloud.
Different reports can apply different definitions to the same source. We trace the joins, filters, and calculation rules before deciding what needs to change.
Provider identities, encounter history, work RVUs, and specialty groupings.
Do the reports use the same provider and period?
Charges, payments, adjustments, denials, and accounts receivable.
Can payments be tied to the work that generated them?
Ledger totals, compensation calculations, and management reporting.
Which differences are timing, and which are logic?
Illustrative assessment questions. Source availability and definitions vary by organization.
The architecture separates incoming records from shared entities and reporting measures. Existing components can stay where they already serve the work.
Retain source-shaped data with load dates and source identifiers.
Check completeness and control totals.Map providers, encounters, charges, and appointments to consistent keys and definitions.
Check linkage, code sets, and rejected records.Prepare reporting tables and versioned metric definitions at the required grain.
Reconcile results to agreed reference totals.Where instrumented with Provenance, runs record inputs, transformations, validation results, and lineage across these steps.
Reference architecture, scoped per engagement. Prepared data can support existing BI tools, Insights, and governed AI access through Insights MCP.
A readiness assessment maps the measures you need to the sources you hold. The findings distinguish available data from missing feeds, weak links, and outside dependencies.
Assessment categories, not a score for a particular organization.
Start with one domain and carry it from source to a working analytical view.
Our work includes Azure data-serving delivery, warehouse assessment, and governance and lakehouse design. Platform selection follows your existing environment and the requirements of the engagement.
Inspect the assumptions. Follow the calculations. Review the checks.
The data foundation holds the definitions and prepared data. Reporting presents the results. The workflow record supports review of how a result was produced. Validation of the method and its intended use remains part of the work.
Diagnosis, procedure, and DRG classifications help organize claims into clinical and service-line views.
These figures describe the reference-data build represented here; coverage varies with code-set version.
Our reference-data work combines published sources, configured taxonomies, and versioned classification tables. Prepared tables support repeatable lookups; checks identify gaps and inconsistent mappings. We review the definitions for the intended use, including any inferred complexity measures.
The reference build connects four-level taxonomies through 19 service lines, with five-tier complexity and acuity measures. Published AHRQ and CMS sources are combined with configured categories and AI-assisted assignments during preparation. Once prepared, classification uses versioned tables without a model call for each lookup.
CSV and Parquet reference files, SQL generators, and a Python scorer support use in analytical workflows. Eight tiers of validation check the build for coverage and consistency. A 15-organization evaluation produced an average complexity index of 2.65; that result describes the study sample, not a universal clinical benchmark.
Our working demos use synthetic data. We can walk through a run and a report, then discuss the requirements for your environment.