
Signal Forward Insights
Start with the result. Follow the questions.
Explore physician performance, collections, and operations through connected views built from shared source data. Open a measure to review its definition, follow the trend, and examine the groups contributing to it.
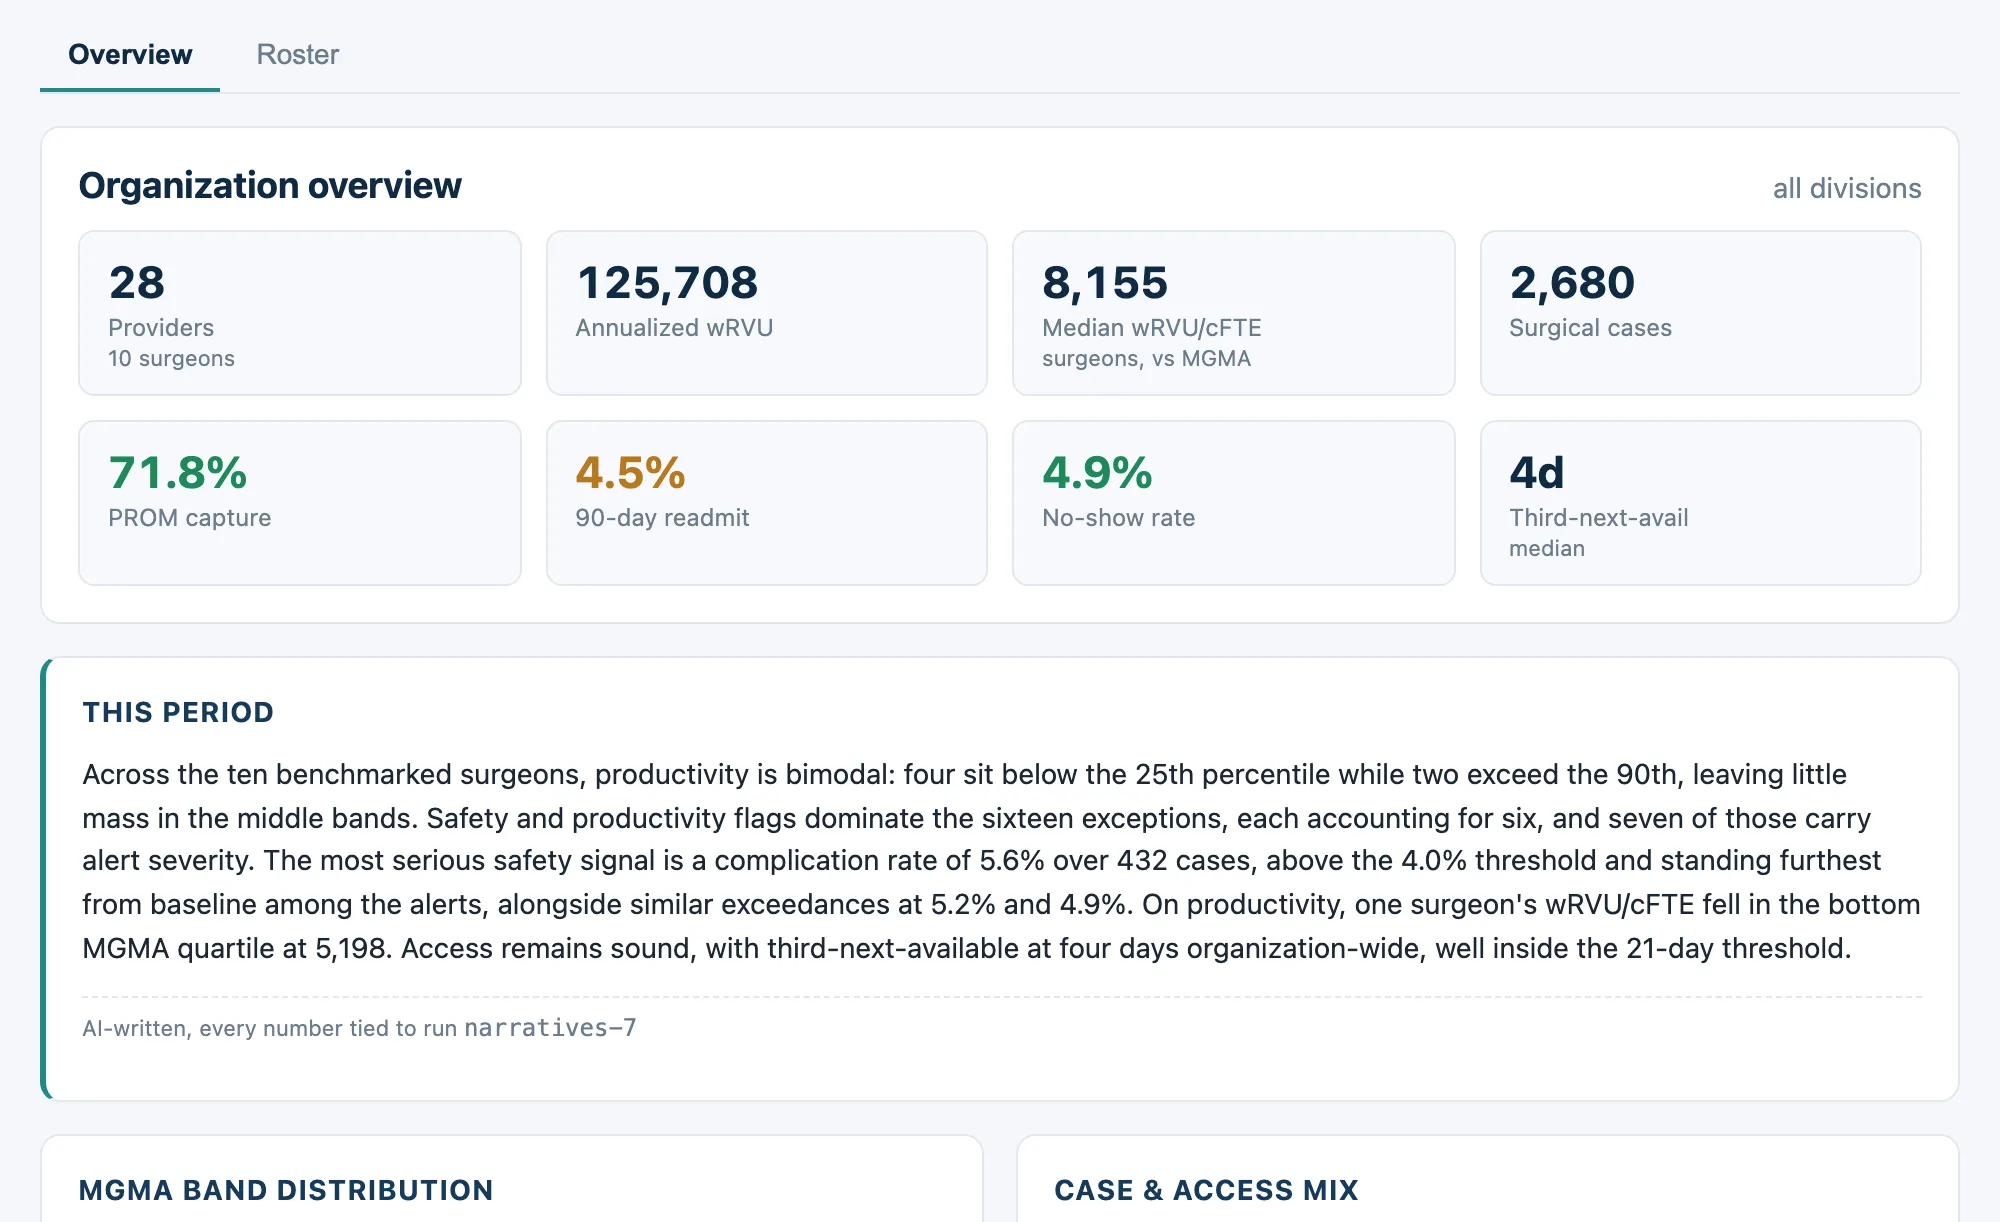
Understand the variation behind the average
Review productivity alongside case mix, quality, access, and collections. Move from the organization to a division or physician, with the relevant benchmarks and exceptions in view.
See where to look next
Period changes, division comparisons, and exception flags give leadership a starting point. Measures link to their definitions and available drill paths.
 View full-size image (new tab)
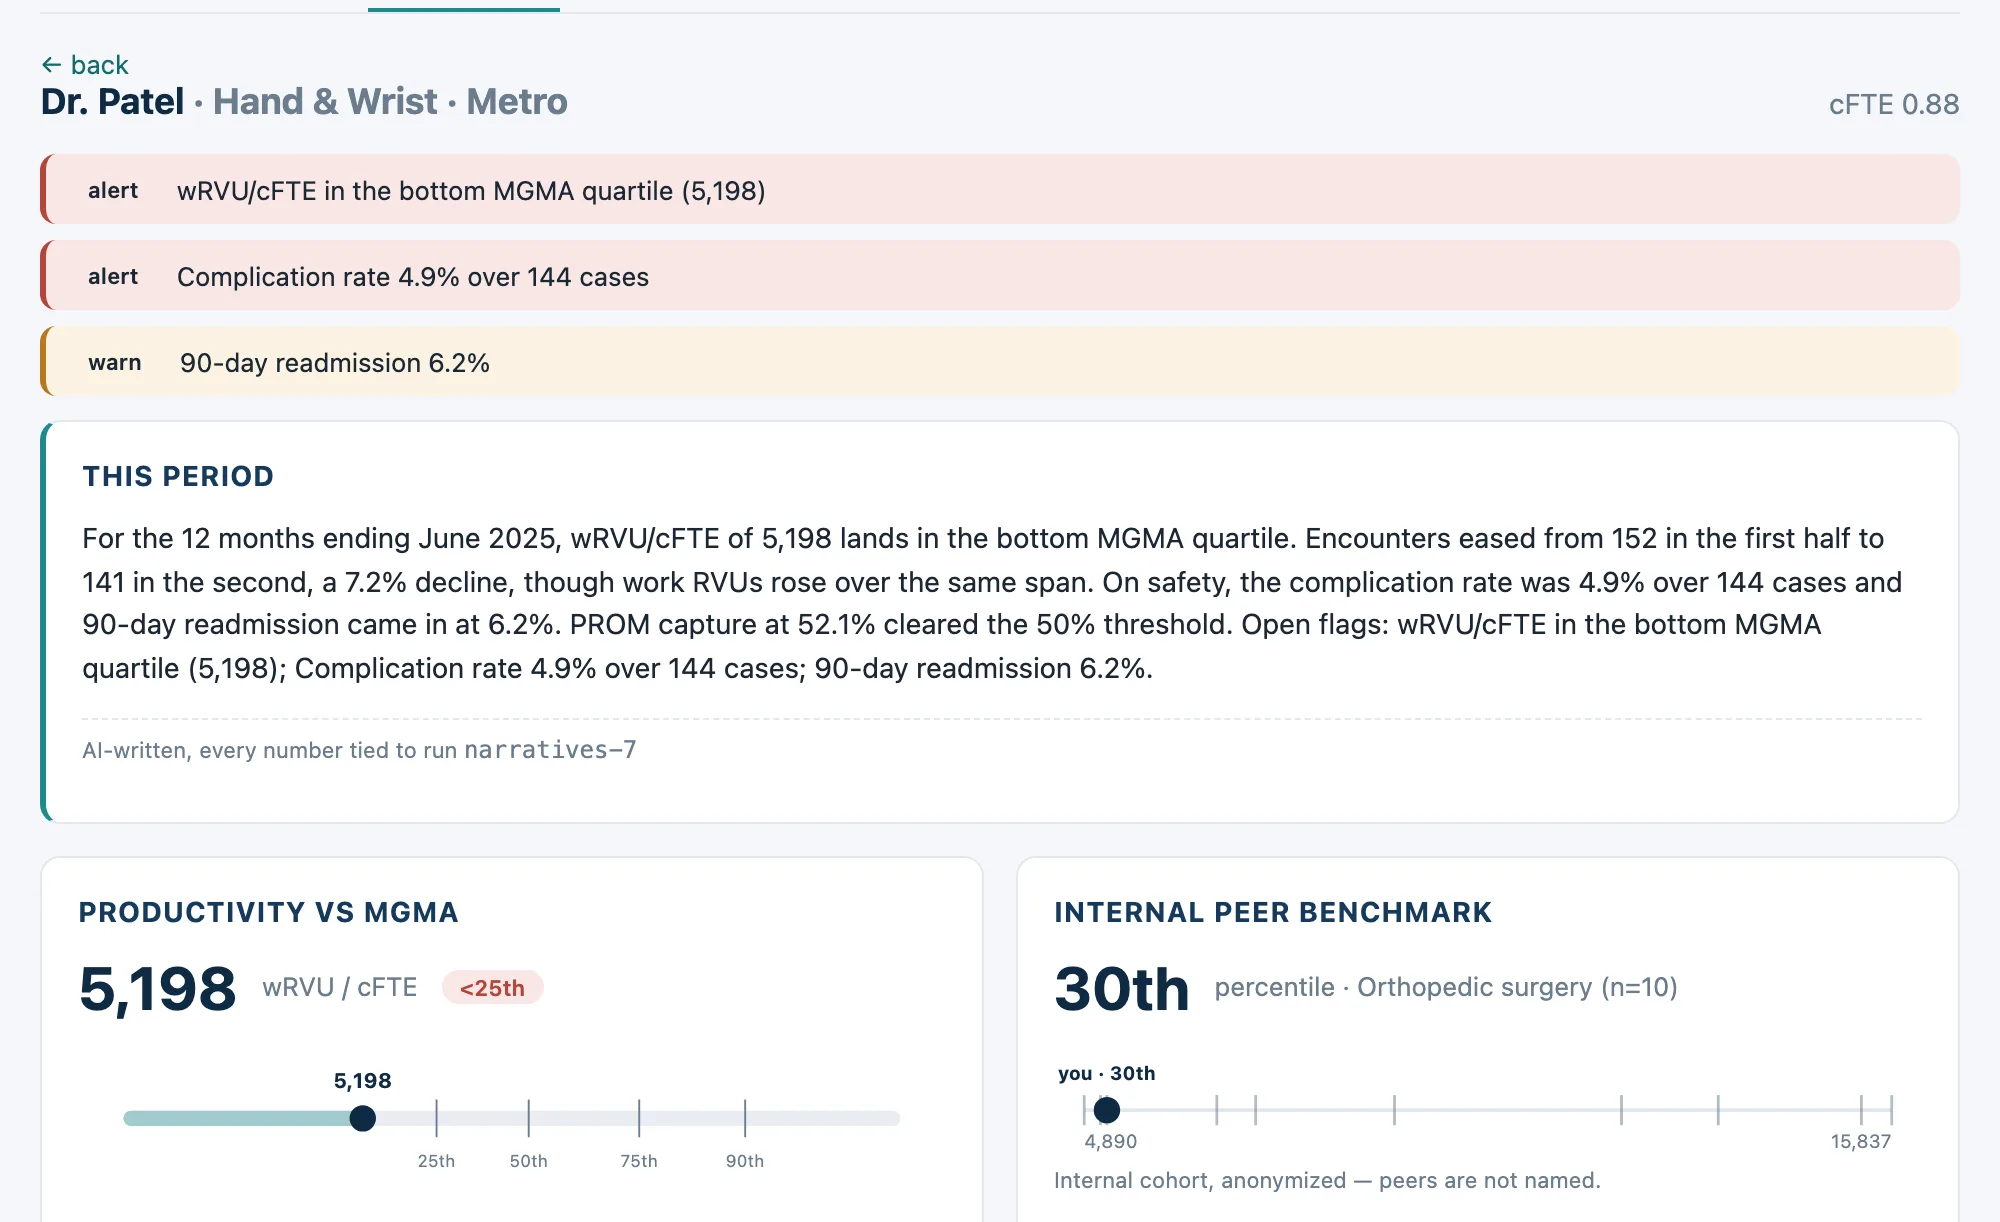
 Put individual performance in context
A physician scorecard brings together productivity, peer comparisons, quality, access, and collections per wRVU. Compensation views relate pay to productivity for authorized readers.
 View full-size image (new tab)
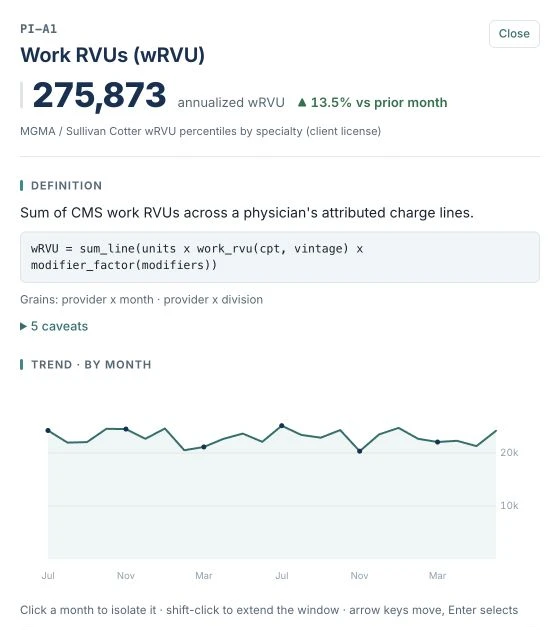
 Open the number
The metric drawer puts the definition, calculation, and monthly trend beside the result. Available breakdowns include provider, division, facility, payer, and clinical categories.
Select a month or a contributing group to narrow the view. Measures that need a fixed cohort or observation window retain that context and explain the limitation.
 View full-size image (new tab)
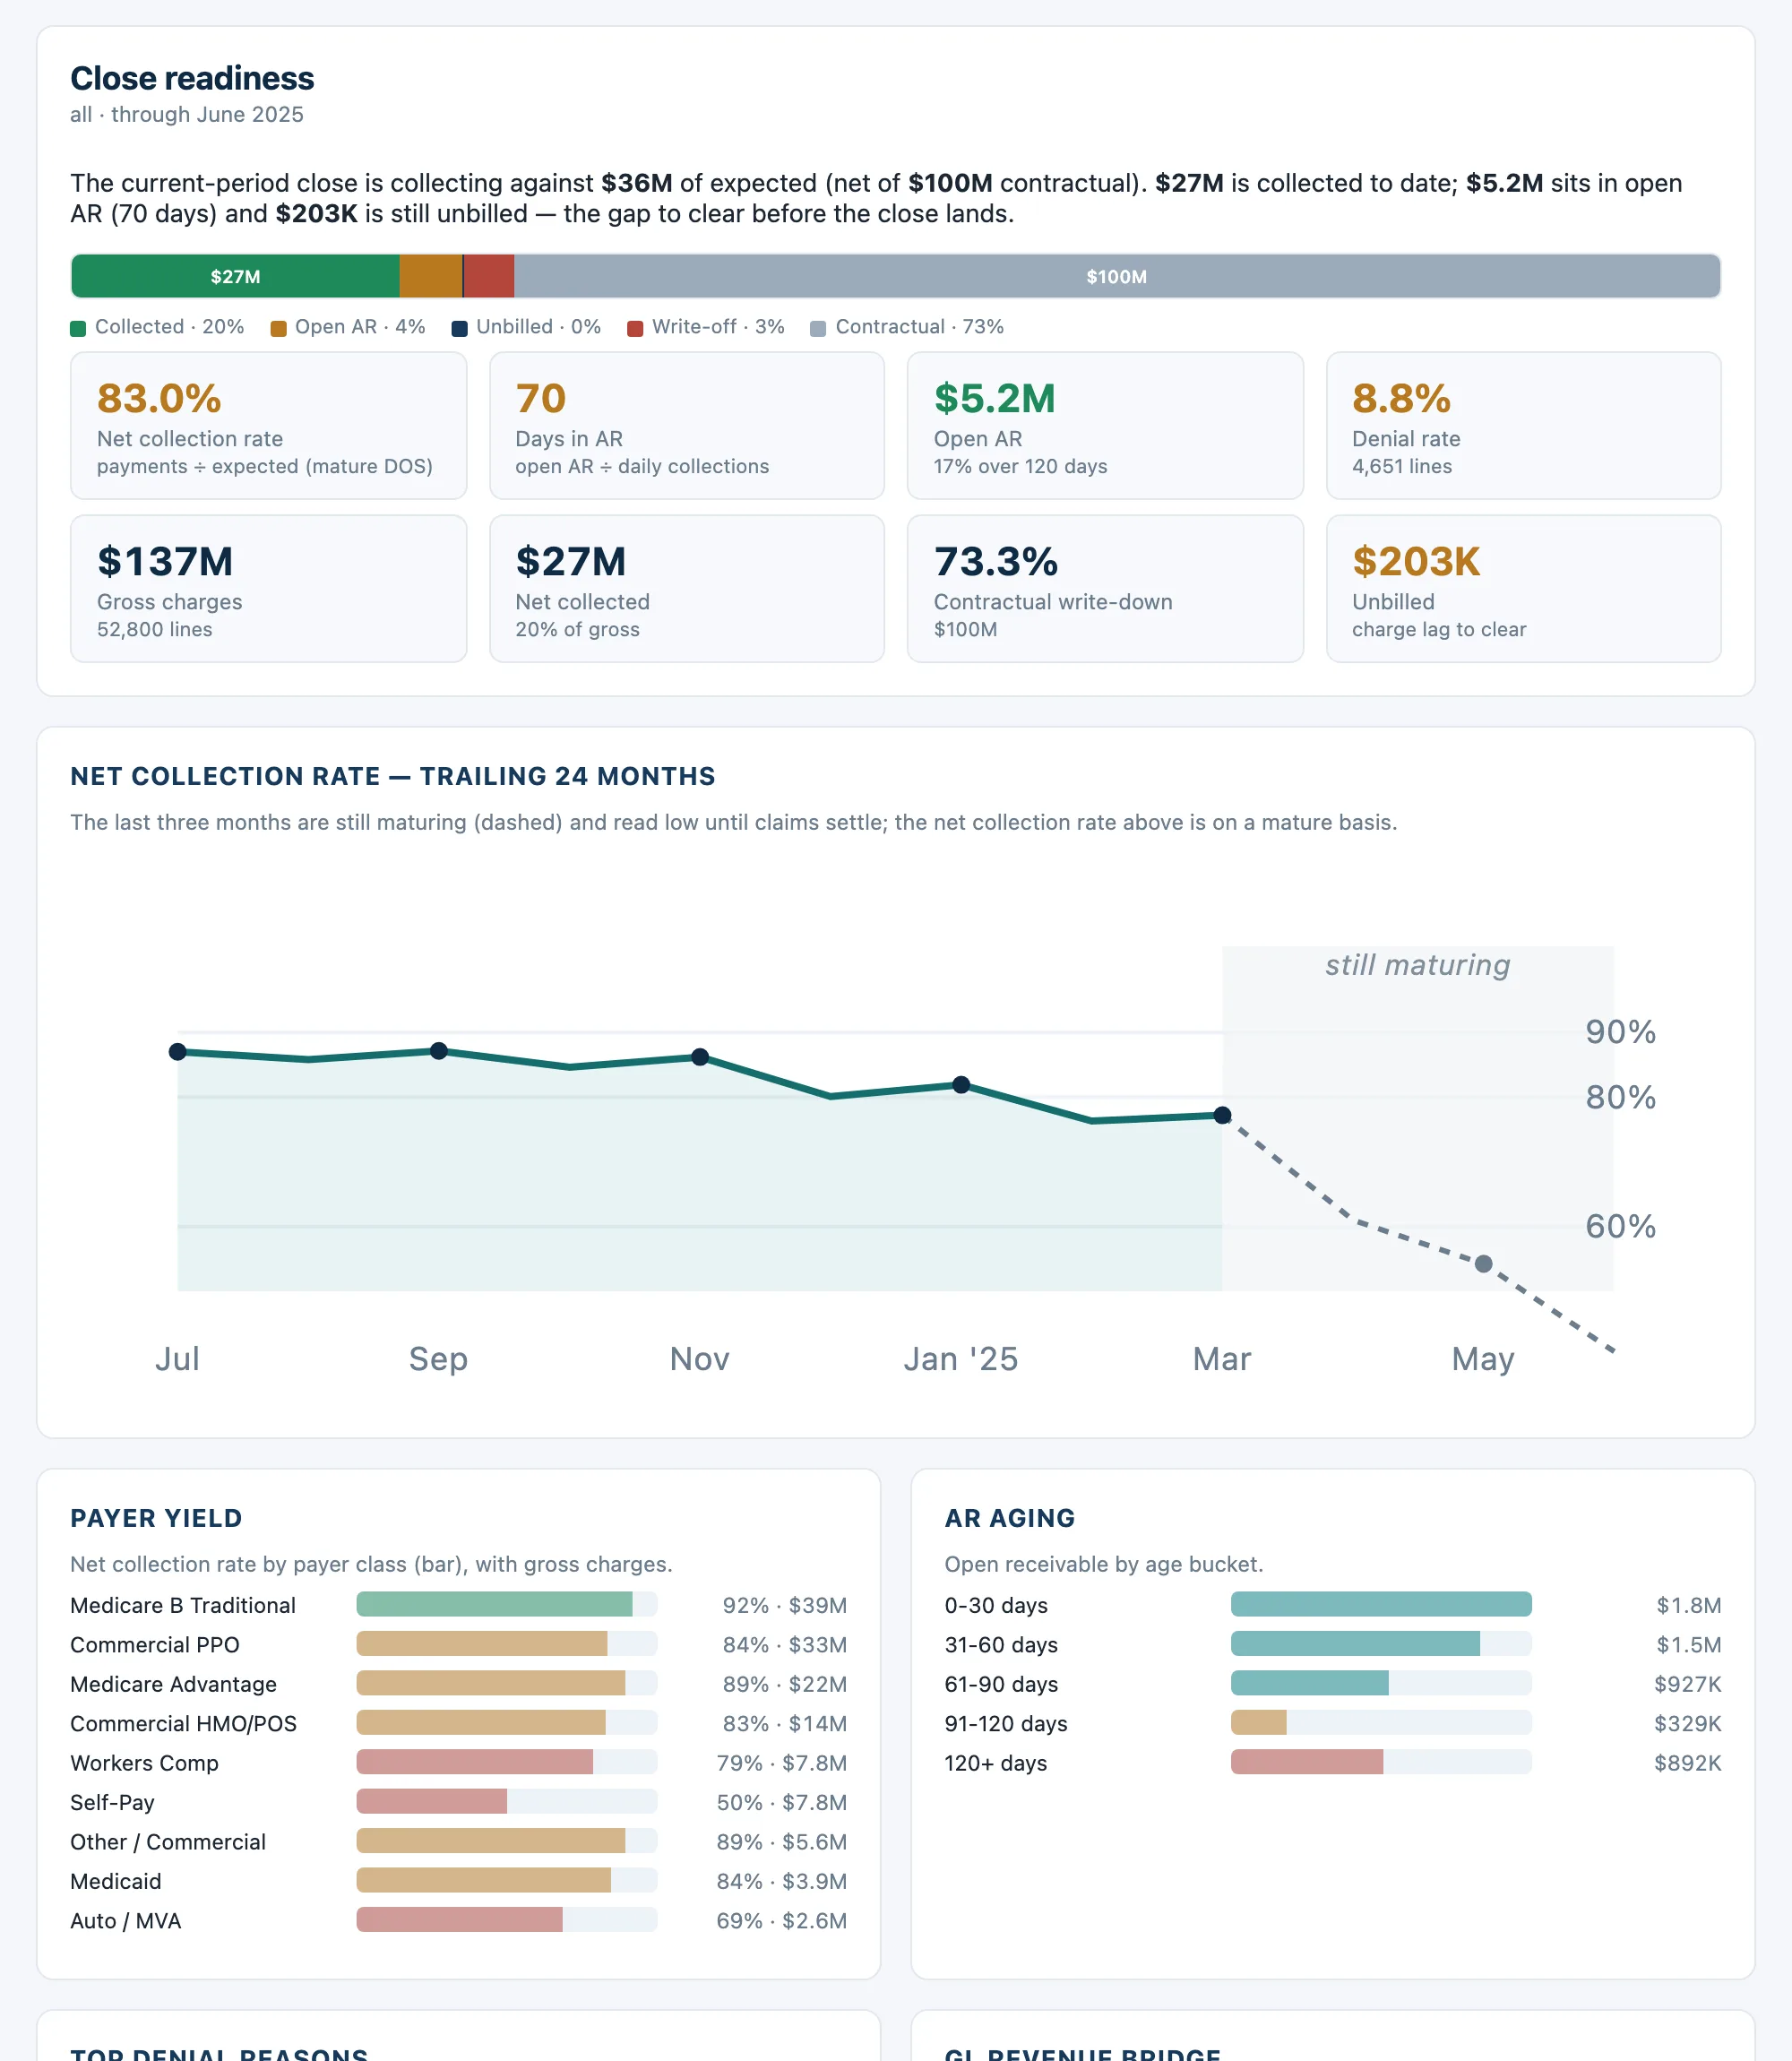
 Follow the gap between work and payment
Review expected reimbursement, payments, adjustments, and open receivables together. Investigate collection rates, denial patterns, payer yield, and charge lag before moving into the worklist.
Bring the close into focus
A collections bridge and aging measures show where balances sit. Exception worklists support assignment and follow-up; the GL bridge connects the review to accounting.
 View full-size image (new tab)
 Read the trend with its timing intact
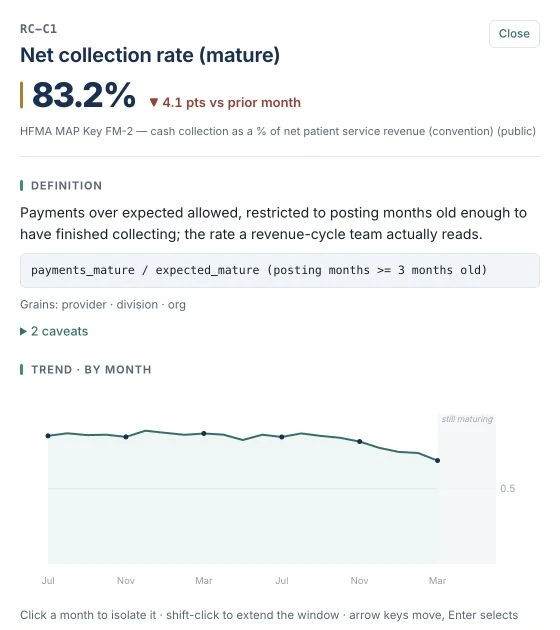
Open the collection rate to inspect the monthly history and compare contributing groups. Recent months are marked as still maturing, keeping collection timing visible when interpreting a change.
The same review pattern applies to payment, denial, adjustment, and charge-lag measures where a monthly trend is meaningful.
 View full-size image (new tab)
 Narrow the question without losing the context
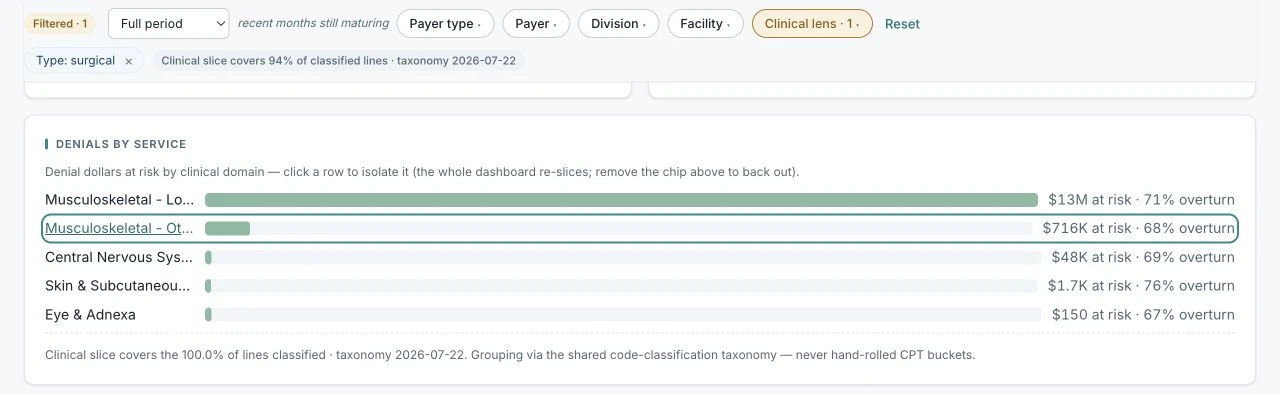
Drill from a service category into clinical domains, groups, and procedure codes. Payer, facility, division, and period filters carry through the collections view as visible selections.
 View full-size image (new tab)
 The same measures, beyond the dashboard
Insights connects to AI tools through Model Context Protocol (MCP). An assistant can discover available measures, inspect definitions, query scoped results, and follow their lineage.
Ask about computed results
The in-app Ask panel and MCP connection use the same metric definitions and access rules. Where included, AI narratives describe computed metrics with references for review. Numeric checks support that review; interpretation still requires judgment.
Take the analysis further
Authorized users can request governed extracts for additional analysis. Extracts retain their scope, filters, and source snapshot. Figures derived from those rows are identified separately from results computed by Insights.
Keep access tied to the reader
Module permissions and data scope apply to both the application and connected tools. Calls and extracts are audited. Patient-level application drill-ins are not exposed through MCP.
Different questions. A shared foundation.
Physician performance and revenue cycle are two of the available modules. Insights also supports access, surgery, referrals, therapy, and transportation network review.
We select and configure the relevant modules for the engagement, connect source data, and agree on definitions, benchmarks, permissions, and handoff.
- Physician performance
- Productivity, case mix, quality, access, and compensation alignment.
- Revenue cycle
- Collections, payer yield, denials, aging, and close readiness.
- Access & front office
- Schedule utilization, appointment availability, no-shows, and cancellations.
- Surgical operations
- Case volume and mix, site of service, cancellations, and implant utilization.
- Referral retention
- Referral destinations, in-network retention, and leakage worklists.
- Therapy
- Visit volume, episodes of care, and plan-of-care completion.
- Network integrity
- Transportation provider capacity, credentialing, and trip exceptions.
Bring a question from your next operating review
A productivity outlier, an aging balance, a change in payer yield. We will walk through how Insights helps examine it and discuss the data and workflow your team would need.
The images above are real captures of a fictional orthopedic group using synthetic data. Benchmarks shown in the demo are illustrative.